Step 1: Preparing Materials
STEP 1: PREPARING MATERIALS
File Organization (1.1)
README (1.2)
Codebook (1.3)
Data (1.4)
- Ethical Challenges to Data Sharing
- Data Citations and Access Information
- Tips for Preparing Data
- Exemplar Data
- Data Checklist
Code (1.5)
- File Organization
- Relative File Paths
- Compute Environment Dependencies
- Formatting of Tables/Figures
- Exemplar Code
- Code Checklist
Return to SPPQ Journal Verification Framework
File Organization (1.1)
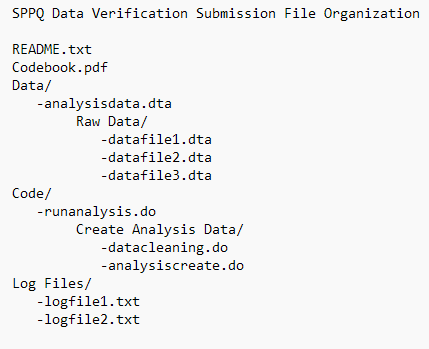
The first step in preparing materials for submission to SPPQ Dataverse is to review how the files are organized and labeled. Files should be clearly named and, if necessary, stored in appropriately labeled folders. If the analysis code calls files from specific folders, this is the time to double check that everything is where it should be and that the code successfully calls those files in from their proper location. The code should run without requiring edits by the verification team.
Dataverse is able to maintain a folder hierarchy. When uploading to Dataverse you may use File Paths to designate folders. Alternatively, you may zip all of your folders together and simply upload that file to Dataverse. Dataverse will unzip the file and create the folders for you. See Uploading Materials (3.3) for detailed guidance.
Note: Dataverse will only generate folders that house files. If an empty folder needs to be created (i.e., an output folder), please include a blank text file within that folder to ensure Dataverse creates it during upload
When submitting your verification package to SPPQ Dataverse, please keep in mind that the Odum Verification Team needs only those files necessary to describe and run the analyses from your manuscript and appendices. All extraneous files, including copies of the manuscript and appendices, should be removed from the verification package.
A complete verification package should include:
| File | Description | Format |
|---|---|---|
| README | Provides context to the dataverse dataset including the title of the manuscript, the compute environment and software dependencies, the names of all other files contained in the dataverse dataset and a brief description of each file. Full data citations must also be included for all original/raw data sources as well as instructions for accessing any restricted data that cannot be provided within the dataverse. | TXT |
| Codebook | Describes all variables within the analysis dataset(s). The codebook should always contain variable definition information for all variables used in the analysis with defined values and value labels. If the data are stored in a text file, then formatting information must be provided as well. | |
| Data | One or more files containing the data required to reproduce all tables, figures, and other analytic results reported in the article and its Supporting Information. | Stata.dta files; data objects within an R package; SAS files; SPSS files, etc. |
| Code | One or more files containing the software commands that can be applied to the analysis dataset in order to reproduce all tables, figures, and other analytic results presented in the article. If applicable, include code for generating analysis dataset(s) from raw or original data files. | Stata .do files, R command scripts, or text files appropriate for submission to other software systems and environments |
| Log File(s) | One or more files produced by the statistical software being used to run the analyses in the article. The log file(s) should include all software dependencies, package versions, and a log of the successful output of results from running the analyses within the authors’ own compute environment. | TXT |
Once you’ve completed your review of the file organization, please move to the next section README (1.2)
README (1.2)
After reviewing the file organization, the next area to focus on is the README. The README is a file that provides an overview of your verification files in SPPQ Dataverse and information that a future replicator would need to execute your analyses. This file must be saved as a text file (.TXT) and include the following information:
-
Title and Author(s) of the article
-
Compute environment dependencies:
-
Operating system and version (ex: Windows 10, macOS 12 Monterey)
-
Statistical software and version (ex: R v4.0.1, Stata SE 16)
-
Packages and versions used in analysis (ex: ggplot2_0.9.0)
-
Run time for executing code
-
-
List of all files within your verification package and a description of each file
-
Full data citations for any original data used in your analyses
-
Access instructions for all original data sources (in the event these data cannot be shared.)
-
For submissions that conducted their analyses on a high-performance compute environment, please provide the script(s) used to schedule the resources (i.e. SLURM or PBS scripts, etc.). These scripts include important information such as the memory needed, the time needed, and the number of processes to run (nodes, tasks, etc.)
-
For submissions that do not have a coding environment (such as Excel, ArcGIS, QGIS, GRASS, Tableau, etc.), you must provide detailed, step-by-step instructions for creating results using these programs
The README should provide curators and verifiers with enough information to understand the contents of the verification package as well as details for setting up the compute environment necessary to run the analyses. Additional information may be provided within other documentation such as the codebook or code files, but the README should be the first place this information is introduced.
💡 Tip: Use Code Commands to Generate Compute Environment Information
Stata and R have commands available to generate details about the compute environment being used to run the analyses. There are also commands to list the packages and library dependencies necessary for the code to run without error.
Stata Example:
* Using the ‘version’ command in Stata
* StataCorp. 2019. Stata 16 Base Reference Manual. College Station, TX: Stata Press.
https://www.stata.com/manuals/p.pdf#pversion

The ‘version’ command will tell you which version you are currently using.

* Using the dis "’c(machine_type)’" command in Stata
* Anuranga, C. 2013. Identify the computer on which Stata is running. StataList.
https://www.stata.com/statalist/archive/2013-10/msg00627.html

The command ‘dis “’c(machine_type)’”’ will also tell you if you are using a 64 or 32 bit machine type. Please also be sure to include the type of Stata being used (IC, SE, or MP).
R Example:
# Using the R.Version command in R
# R Core Team (2019). R: A language and environment for statistical computing. R Foundation for Statistical Computing, Vienna, Austria.
URL https://www.R-project.org/.
#“R.Version” lists the R version and the computer platform.

# Using the (.packages()) command in R
# R Core Team (2019). R: A language and environment for statistical computing. R Foundation for Statistical Computing, Vienna, Austria.
URL https://www.R-project.org/.
# After a script has been run, the command “(.packages())” will list all of the packages that have been loaded during the session.
These commands are available in the base Stata and R software and can provide more context about the specific version and packages used to run your analyses. There are many instances where different compute environments, software or package versions can impact the output and either cause errors within the code or generate different results.
Describing Materials Within Your README
As part of the verification review, Curators compare the README against the verification submission package and look for the following:
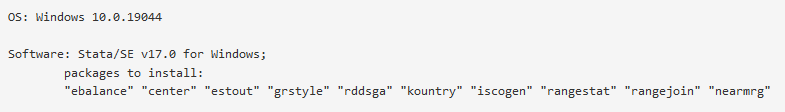
- Full description of compute environment and all software dependencies. The compute environment should describe the operating system and version used for analyses. The software dependencies should describe all statistical software, their versions, as well as any packages (and version of packages) necessary to rerun the analyses from your manuscript. An example of a well-described compute environment would be:
- All files in the submission package are listed and described. If there are fifteen files in the SPPQ Dataverse record, then there must be fifteen files listed by full filename and described in the README. Filenames should match the filenames in the dataverse record, meaning if the file is labeled ‘state_data_2018’ in the dataverse, it must be labeled ‘state_data_2018’ in the README. Additionally, all files must be described in the README.
-
An example of this would be:
State_data_2018.dta – analysis data file used in Figure 1
State_data_figure1.do – code to generate Figure 1 that uses state_data_2018.dta
-
- Full data citations for all original source data. If you are using any data produced by others (government, researchers, non-profts, etc.), you must provide complete data citations for each of your sources along with access instructions (if appropriate). A data citation should be robust enough to direct secondary users to the original source data provider. Guidance for constructing a complete data citation can be found through ICPSR’s Citing Data.
-
An example of a full data citation would be:
Source: Döring, Holger, Constantin Huber, and Philip Manow. 2021. Parliaments and governments database (ParlGov): Information on parties, elections and cabinets in established democracies. Development version. https://www.parlgov.org/data-info/
-
- In the event original source data cannot be shared due to Terms of Use or restrictions implemented by the data producer, instructions must be provided describing how to request access to these data. Instructions should include the data citation, the point of contact (if available), and the exact data files requested and used in your analyses. If there was a fee incurred, it would be useful to note this in the README as well for prospective users.
README Template
If you would like to construct your README using a fillable template, please see the README Template section.
Exemplar READMEs
- Singer, Matthew, 2023, “Replication Data for: Dynamics of Gubernatorial Approval: Evidence from a New Database”, https://doi.org/10.15139/S3/QHHQEF, UNC Dataverse, V1; readme.txt [fileName]
- Hughes, David; Wilhelm, Teena; Vining, Jr., Richard L., 2023, “Replication Data for: Chief Justice Selection Rules and Judicial Ideology”, https://doi.org/10.15139/S3/Q4NKOK, UNC Dataverse, V1; README.txt [fileName]
- Matthews, Abigail A.; Schilling, Emily U.; Kreitzer, Rebecca J., 2023, “Replication Data for: Timing Their Positions: Cosponsorship in the State Legislature”, https://doi.org/10.15139/S3/VRZZDP, UNC Dataverse, V1; README.txt [fileName]
Once you have completed the above checklist, please move to the next section of this guide Codebook (1.3)
Codebook (1.3)
The codebook is a document or document(s) that describe the contents of the analysis dataset(s) provided as part of the verification submission package. It must be submitted as a PDF to ensure long-term preservation and access and should include the title and author(s) of the manuscript on the first page.
A codebook for each analysis data file is required as part of the verification submission package. You may submit your codebook either as a single PDF containing clearly labeled sections describing each analysis data file OR as multiple codebooks, one for each analysis data file.
Describing a Data File Within Your Codebook
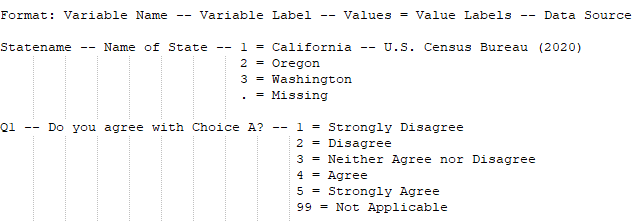
The contents of your codebook should answer all questions a user might have when looking at your data file. This means that every variable in your analysis dataset(s) must be clearly labeled and defined. Consider the following sample data file:
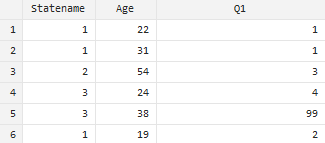
This does not convey much information to users unfamiliar with your data file. You can clean up your data file by including labels within the statistical software you are using which would provide more context, as seen in the sample below:
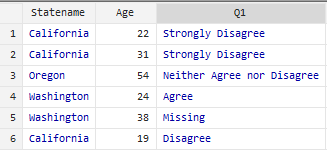
Defining these values within your data file also helps generate a more robust codebook using the statistical software itself.
💡 Tip: Use Code Commands to Generate a Codebook
Stata and R both include functions that can be used to generate much of the variable information required to be included in your codebook. The ability of these functions to output useful information, however, relies on the presence of variable and value labels in the data file. Prior to executing these commands, double check that each variable is assigned a label and that all values for those variables are defined in the dataset.
Stata Example:
* Using the codebook command in Stata
https://www.stata.com/manuals/dcodebook.pdf

Syntax:
codebook [ varlist ] [ if ] [ in ] [ , options

* Using the labelbook command in Stata
https://www.stata.com/manuals/dlabelbook.pdf

Syntax:
labelbook [ lblname-list ] [ , labelbook options ]
R Example:
# Using the codebook package in R
# Arslan, R. (2020, June 6). Package ‘codebook’. Version 0.9.2. CRAN Repository. https://cran.r-project.org/web/packages/codebook/

Syntax:
codebook(
results,
reliabilities = NULL,
survey_repetition = c("auto", "single", "repeated_once", "repeated_many"),
detailed_variables = TRUE,
detailed_scales = TRUE,
survey_overview = TRUE,
missingness_report = TRUE,
metadata_table = TRUE,
metadata_json = TRUE,
indent = "#"
)

# Using the dataMaid package in R
# Petersen, A., & Ekstrøm, C. (2019, December 10). Package ‘dataMaid’. Version 1.4.0. CRAN Repository. https://cran.r-project.org/package=dataMaid

Syntax:
makeCodebook(data, vol = "", reportTitle = NULL, file = NULL, ...)
It is important that you review the codebook to be sure that the output produced by the codebook-generating command includes the complete list of all variables in the data file along with variable labels, values, and value labels for each variable.
As part of the verification review, Curators compare the codebook(s) against each analysis data file and look for the following:
- All variables in the analysis data file(s) are present in the codebook(s). If there are 35 variables in the analysis data file, there must be 35 variables described in the codebook. We refer to this as a 1:1 match.
- Each variable name in the analysis data matches the variable name in the codebook. If the variable is named ‘stateno’ in the analysis data file, then it must also be named ‘stateno’ in the codebook.
- Every variable is fully described using variable labels in the codebook. For example, using the sample data above ‘Q1’ is the name of the variable and the label would be: “Do you agree with Choice A?” This provides necessary context for users about the variable ‘Q1’.
- All values are included in the codebook for each variable and each value is labeled. All binary, categorical, and/or ordinal variables must have their values included and described. For example, if the variable ‘Statename’ has values of ‘1’, ‘2’, and ‘3’, they must be listed in the codebook. Additionally, each value must be labeled so users know what ‘1’ equals. Therefore, the codebook would include the following information about ‘Statename’:
-
Variable Name: Statename
-
Variable Label: Name of State
-
Values:
-
1 = California
-
2 = Oregon
-
3 = Washington
-
-
- Missing values are described in the codebook. If your data contain missing values or empty cells, you must include this information within your codebook. For example, in a Stata data file, missing values might be denoted by a period ( . ). If this value means ‘Missing’ for all variables within your data file, we recommend including a footnote in your codebook explaining as much.If you have different values representing ‘missing’ values, you must define each value underneath the appropriate variable. For example, if variable ‘Q1’ has a value of ‘99’ meaning ‘N/A’, but variable ‘Statename’ has a missing value defined as ‘.’, then you would include this information under each applicable variable.
Codebook Template
While you may construct your codebook using the commands provided above, we have also created a codebook template. This template provides the basic structure of a codebook that you may customize to meet your needs.
Exemplar Codebooks
- Rouse, Stella, 2023, “Replication Data for: Local Candidate Roots and Electoral Advantages in U.S. State Legislatures”, https://doi.org/10.15139/S3/FMYG8Z, UNC Dataverse, V1; hunt_rouse_sppq_codebook.pdf [fileName]
- DeHart, Cameron; Mamet, Elliot, 2023, “Replication Data for: Do Reserved Seats Work? Evidence from Tribal Representatives in Maine”, https://doi.org/10.15139/S3/UR20AA, UNC Dataverse, V1; Codebook.pdf [fileName] Meyer-Gutbrod, Joshua, 2022, “Replication Data for: Preaching to the Choir or Proselytizing to the Opposition: Examining the Use of Campaign Websites in State Legislative Elections”, https://doi.org/10.15139/S3/DNNRIZ, UNC Dataverse, V1; Codebook.pdf [fileName]
Once you have completed the above checklist, please move to the next section of this guide Data (1.4)
Data (1.4)
Data are the evidence underlying the results, both in text and visualizations, in your manuscript and supporting information (SI). The SPPQ verification policy requires authors to submit only data required to replicate the results, which might be a single file or multiple files. If you use original, external data sources (i.e., not produced by the authors), you need to provide the raw data along with the code to construct your analysis data. For purposes of this guide, we define raw and analysis data as:
- Raw data, or sometimes called primary data, are data collected from a data producer such as government census data or shapefiles.
- Analysis data are raw data that have been cleaned, organized, processed, or manipulated in some manner to support your analysis and interpretation.
Depending on the situation, you may need to submit both raw and analysis data for verification.
Ethical Challenges to Data Sharing
The verification policy supports open and accessible data. There are situations when publicly sharing data are not appropriate or possible. Below are a few examples of instances where there are ethical challenges to sharing data such as:
- Personally identifying information (PII) (e.g., names, telephone numbers, dates of birth, IP addresses, or information that directly or indirectly identifies an individual);
- Personal health information (PHI) (e.g., medical records, diagnoses);
- Copyright or intellectual property rights;
- Restrictive terms of use or license agreements; and
- Compliance with government or legal mandates (e.g., EU GDPR, FERPA, HIPAA).
If you expect that your data might have an ethical challenge, there are options for complying with the verification policy such as sending the restricted data through the editors and not posting publicly in Dataverse, providing data access instructions for verification staff to obtain the raw data, asking permission from data producers, etc. For additional information, please see the following section Assessing Data for Sharing (2.2) and consult the editors.
Data Citations and Access Information
If your manuscript utilizes original, external data sources (i.e., not produced by the authors), you need to cite all data sources used in your research to ensure data producers receive proper scholarly acknowledgement. For crafting a formal data citation, please see the ICPSR’s Citing Data style guide at https://www.icpsr.umich.edu/web/pages/datamanagement/citations.html.
Examples of Data Citations:
- Jolly, Seth, Ryan Bakker, Liesbet Hooghe, Gary Marks, Jonathan Polk, Jan Rovny, Marco Steenbergen, and Milada Anna Vachudova. 2022. “Chapel Hill Expert Survey Trend File, 1999-2019.” Electoral Studies 75 (February). https://doi.org/10.1016/j.electstud.2021.102420 Accessed 2022-09-01.
- Greene, Kenneth. Mexico Panel Study, 2012. Ann Arbor, MI: Inter-university Consortium for Political and Social Research [distributor], 2016-03-11. https://doi.org/10.3886/ICPSR35024.v1 Accessed 2022-09-01.
- Office of the Registrar General Census Commissioner, Government of India. 2022. Census of India, 1991 and 2001. Delhi, India. https://censusindia.gov.in/census.website/data/census-tables Accessed 2022-09-01.
In addition to a formal data citation, you must ensure there is enough information for a future verifier to discover, select, and access the same data that you used in your research. We recommend that you include a direct URL, data identifier (e.g., DOI, ARK, hdl), data set title, or search parameters to ensure the same data are selected.
Examples of Data Access Instructions:
- Swift, Clint S.; VanderMolen, Kathryn, 2020, “Replication Data for: Marginalization and Mobilization: The Roots of Female Legislators’ Collaborative Advantage in the States”, https://doi.org/10.15139/S3/WVINT7, UNC Dataverse, V1, UNF:6:u7vdg0sus/giRHYAayhLaw== [fileUNF]
-
This example includes author-compiled data files used in the analysis. Instructions are provided in the README.txt on how the files were constructed and formal data citations are provided in the codebook.
-
- Nemerever, Zoe; Butler, Daniel, 2020, “Replication Data for: The Source of the Legislative Professionalism Advantage: Attracting More Knowledgeable Candidates”, https://doi.org/10.15139/S3/MPTNKT, UNC Dataverse, V1
-
This example requires users to request access to restricted data. The data access instructions are included in the README.
-
Tips for Preparing Data
As part of the verification review, Curators and Verifiers check the data for the following:
- Files open and are not corrupt,
- Data are complete to replicate the analyses and results, or a justification is provided for why data are missing,
- Data file only contains the variables required to replicate your results (i.e., if the raw data contains 1000 variables but you use only 20 variables in your analysis, only submit the 20 variables for verification),
- Incomplete, inconsistent, or missing variable and value labels,
- Enough information exists on how data is structured to support future use,
- Data do not contain personal, proprietary, or restricted information,
- No intellectual property or copyright issues,
- If using original data source, a formal data citation and data access instructions are included to enable data discovery
Additional recommendations in preparing your data for verification:
- Keep a data audit trail so you know all the changes that were made to these data starting from data collection to analysis
- If using a common statistical program (e.g., Stata, R), take advantage of variable descriptions and labels to support future use and interpretation as well as codebook generation (see Codebook 1.3)
- If you are using a less commonly used software, please provide information on how the data is structured
- For databases, please provide the database program and schema including table names, relationships and any keys (e.g., primary, foreign)
- For maps, please include all the shapefiles, data and code for reshaping the data, .mxd file, and instructions on the layers or shading
- For Tableau and Gephi, please provide any manual steps for manipulating the data or visualizations
Exemplar Data
- Meyer-Gutbrod, Joshua, 2022, “Replication Data for: Preaching to the Choir or Proselytizing to the Opposition: Examining the Use of Campaign Websites in State Legislative Elections”, https://doi.org/10.15139/S3/DNNRIZ, UNC Dataverse, V1, UNF:6:FpFWRyR+41AJt42JrpgynA== [fileUNF]
- Thornburg, Matthew, 2022, “Replication Data for: The Dynamics of Hidden Partisanship and Crossover Voting in Semi-Closed Primaries”, https://doi.org/10.15139/S3/M3NXWH, UNC Dataverse, V1, UNF:6:FGkQODMZ4UvBLW84hQhiUw== [fileUNF]
- Emrich, Colin, 2022, “Replication Data for: Conference Committee Structure and Majority Party Bias in U.S. States”, https://doi.org/10.15139/S3/Q10HBY, UNC Dataverse, V1, UNF:6:rcAvdUCr4pbXv8oWx0QJdQ== [fileUNF]
Once you have completed the above checklist, please move to the next section of this guide Code (1.5)
Code (1.5)
The replication package should include executable code files that implement necessary steps to manipulate the original data and reproduce all tables, figures, and other analytic results in the SPPQ article. Typically, these will be plain text files with syntax that is recognizable and executable by your chosen programming language/software. The submitted file types will depend on the specific program. For example, authors may provide Stata .do files, R command scripts, .py Python scripts, or MATLAB m-files. Other types of plain text files to execute in other software systems and environments may be appropriate as well.
File Organization
Authors have discretion in how to organize script files that are part of the replication package and the code therewithin. For example, you may submit a single code script that contains all steps for running the analyses reported in the SPPQ article. Alternatively, you may provide multiple modular script files that separately perform different steps of the analysis. In the latter case, you must provide a “master” script that executes all other scripts in the correct order. In either case, it is best practice to use meaningful rather than generic file names to indicate the purpose of each code script (e.g., “table5_summarystats.do” instead of “stata_code.do”). In addition, you should make extensive use of comment statements throughout each script file to distinguish the commands used for different figures, tables, or other analytic results. This is important for coding steps to be matched to the published results in the manuscript.
💡 Tip: Use comments to label code sections that produce each figure/table.
Stata Example:
** —----------------------------------------------------
** FIGURE SI1

use "country_2011.dta", clear

** Define variables
g germans = pop_de/1000000
g czechs = pop_cz/1000000
g total = pop/1000000

scatter germans total czechs year, ///
connect(l l l) lcolor(gs8 gs12 black) ///
mlcolor(gs8 gs12 black) scheme(lean1) xlabel(,labsize(medium)) ///
ylabel(,labsize(medium) nogrid format(%9.0f)) /// ytitle("Population (in millions)") xtitle("") ///
msymbol(O S T) mcolor(gs8 gs12 black) ///
msize(large large large) xsize(7) ///
legend(order(2 3 1) label(1 "Germans") label(2 "Total population") label(3 "Czechs") size(medium))
R Example:
## —----------------------------------------------------
## Table A1.  Full Coding Results for a Random Subset of Competitive Reality/Game Shows

load("tvcoding.rdata")

first <- CohenKappa(tvcoding$ordinary1,  tvcoding$ordinary2,
  weights = c("Unweighted"))
second <- CohenKappa(tvcoding$benefit1,  tvcoding$benefit2,
  weights = c("Unweighted"))
third <- CohenKappa(tvcoding$hardwork1,  tvcoding$hardwork2,
  weights = c("Unweighted"))

# Cohen's Kappa (unweighted) for the first category
round(first, digits=3)

# Cohen's Kappa (unweighted) for the second category
round(second, digits=3)

# Cohen's Kappa (unweighted) for the third category
round(third, digits=3)
Relative File Paths
Code files should not contain multiple references to “hard-coded” file paths such as “C:/Users/MyName/Documents”. Instead, it is best practice to set the working directory (i.e., parent directory) only once, typically in the “master” script or in the first few lines of code. This allows other users to run all the scripts on a local computer by changing only one line of code. All other file paths should describe the file location relative to the working/parent directory. Be sure to maintain the same folder structure in the Dataverse submission, so that relative file paths will work for anyone that downloads the replication package (after editing the working directory).
💡 Tip: Set working directory once and use relative file paths in Stata and R
Stata Example:
** Use cd command to change directory
cd "C:/Users/Name/Documents/Project"

** Use relative path to import datafile stored in project folder
import delimited “data/datafile.csv”, delim(“,”)
R Example:
## Use setwd command to set working directory
setwd("C:/Users/Name/Documents/Project")

## Use relative path to read datafile stored in project folder
df <- read.csv(“~data/datafile.csv”)
Compute Environment Dependencies
Authors should specify the local computing environment and software program, including the specific versions used. This requirement is important since some commands and algorithms may change across environments and software versions. In addition, analyses may require specialized packages such as Stata .ado files or R packages that are not included in the base software. Please document any additional packages that are required for replication, including the package version (if applicable), and provide code or instructions for installation. Finally, any commands that generate random numbers (e.g., for Monte Carlo simulations, bootstrap resampling, jittering points for display in figures, etc.) should include a seed value in order to ensure consistent results.
💡 Tip: Include lines of code to install packages
Stata Example:
** Install necessary packages
ssc install coefplot
ssc install estout
ssc install rdrobust
R Example:
# Install R packages
list.of.packages <- c("foreign", "ggplot2", "dplyr", "haven", "xtable", "stargazer", "tidytext", "stringr", "tidyr")
new.packages <- list.of.packages[!(list.of.packages %in% installed.packages()[,"Package"])]
if(length(new.packages)) install.packages(new.packages)

# Load libraries
library(foreign)
library(ggplot2)
library(dplyr)
library(haven)
library(xtable)
library(stargazer)
library(tidytext)
library(stringr)
library(tidyr)
💡 Tip: Document capacity constraints and run time for each code file.
R Example:
########################################
## Monte Carlo Exercise
########################################

# takes about 1.2 hours.
source("code/4_sim_tests_n100.R")

# takes about 3 hours.
source("code/5_sim_tests_n300.R")

# takes about 16 hours.
source("code/6_sim_ife_mc.R")

# takes about 30 minutes.
source("code/7_sim_inference.R")

#### Plot Monte Carlo Results ####

# almost instantly
source("code/8_plot_sim.R")
Formatting of Tables/Figures
There are some cases where you may wish to format your outputs for a stronger visual appeal in your manuscript. Minor manual manipulations of the tables or figures is usually acceptable; however, instructions must be provided within the verification submission package that describe each manual step and any tools used to alter the aesthetics of the tables and/or figures within the manuscript. The results described in the figures and/or tables must be exact to the original output from the code. The Odum Verification Team should be able to walk through each step and achieve the same formatted output present in the manuscript.
Exemplar Code
- Mancinelli, Abigail, 2022, “Replication Data for: Does Public Financing Motivate Electoral Challengers?”, https://doi.org/10.15139/S3/HQFBAY, UNC Dataverse, V1, UNF:6:7b6tFw3VMC8fsZQQ/1uVRg== [fileUNF]
- Warner, Seth B., 2022, “Replication Data for: Measuring Executive Ideology and Its Influence”, https://doi.org/10.15139/S3/NK8O3Z, UNC Dataverse, V1, UNF:6:PhY8yBZpgnkz7Eek7MmTKA== [fileUNF]
- Emrich, Colin, 2022, “Replication Data for: The Politics of Bicameral Agreement: Why and When Do State Lawmakers Go to Conference?”, https://doi.org/10.15139/S3/4EHNZA, UNC Dataverse, V1, UNF:6:Uhm51RrEoECgS1nkWdI6fw== [fileUNF]
Once you have completed the above checklist, please move to the next step of this guide Step 2: Reviewing Materials